An important contrary indicator that I follow has recently made a signal that has been correct every time in the last 14 years.
But before I explain what this indicator is, allow me to make this important point:
As you know, I am a trader and I follow the market. I care about the truth – NOT my ego and not other people’s opinions.
I am committed to a relationship of 100% honesty with you.
Some so-called “experts” have an agenda to spread misinformation – such as “doom and gloom” (and believe me they make a LOT of money by selling their doom and gloom garbage).
I, on the other hand, only listen to what the MARKET is telling me. Because we professionals know that the market is always right and human beings are fallible and irrational.
Warren Buffett – the richest share investor in the world – once said that “Forecasts may tell you a great deal about the forecaster but they tell you nothing about the future.”
He is right. Most “experts” want to be proven right and therefore ignore any evidence that is contrary to their belief.
Now back to the contrary indicator…
You may recall a few weeks ago I quoted John D. Rockefeller when he said that the best opportunities are when “blood is running down the streets”.
In other words, when everyone is scared and too afraid to enter the market, that is the best time to buy.
Well here is where it gets interesting…
According to research by SentimenTrader, a website dedicated to measuring market sentiment, Barron’s weekly financial magazine sent out a survey asking fund managers’ expectations on stock markets.
And the Big Money (i.e. the fund managers) responded with a very bearish (negative) outlook.
I know what you’re probably thinking. Can Big Money be a contrary indicator? The answer is yes, but only when they shift too far in one direction.
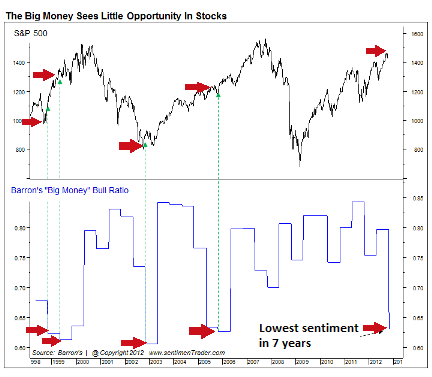
Take a look at this chart (below). It shows what the stock market did between 1998 and now after every time Big Money got too pessimistic on stocks:

Chart Courtest of http://www.sentimentrader.com
As you see, the stock market not only rallied but it rallied hard after the pessimism reached extremes – such as now. The indicator has been proven to be correct over the last 14 years.
This would indicate that stock markets have most likely bottomed and that it is a good time to buy stocks.
Many other things would support this view as well. For one thing it is a known fact that markets tend to rise in the run up to Christmas. It is a cyclical nature of the markets.
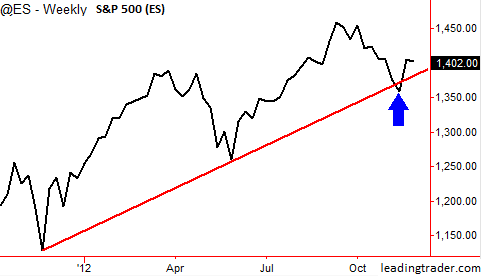
Further, stock markets managed to rebound from a very important support level recently. Take a look at this chart of the S&P 500 (ES):

The S&P 500 (ES) “bounced” from its virtual floor at 1350 as shown by the blue arrow. These “trendline supports” usually do a good job of holding the market.
But the other important question is – what if we are wrong? What if this is not a bottom for stocks and they continue to make new lows?
It is always a wise decision to “hedge” against a market fall.
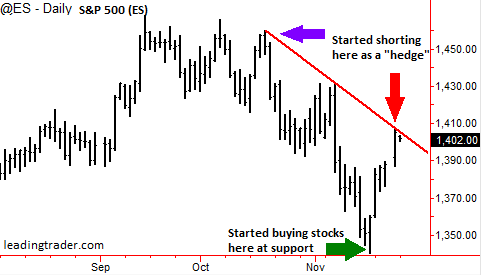
For example, you will see from the below chart that even though we started buying stocks last week (green arrow) we started “shorting”stocks from mid-October to last Friday (as shown by the red and purple arrow). This way we can also profit from a falling market.

So now we have almost a win-win situation so that no matter what happens the risk is minimised.
Right now the market is still in the beginning of what we call the Bernanke Asset Bubble. All the monetary easing and printing the Banks are doing will push up the price of stocks (and metals) to unimaginable heights in the coming few years.
We may not see any “growth” in the economy (and we won’t) but remember the economy lags behind the stock market.
Let me know your own views – even if you disagree with me – by leaving me your comment below.
Alessio Rastani is a full time trader at www.LeadingTrader.com

Hmm, interesting. I have been an investor for 17 years and I have found the rule of doing the opposite of everyone else to be a useful indicator as well. I just didn’t there was a scientific way of doing it. Thanks. Any other ways to hedge if you are in the UK market?
Nice article, and very interesting. I think something which also has to be taken into account is that though base money has increased, leverage has decreased. It would be interesting to see the statistics of overall total money supply plotted against large stock market movements.
I’d be interested to hear about your hedging strategy and how you have set it to be a “win-win”, I mean if you are simply shorting, then surely you either have just reduced your net position on the market (perhaps down to zero), and hence are just not exposed to any winning or losing anymore, and may aswell have just sold, or you have a net short position, in which case you will lose if the markets rally??
Cheers,
Scott
Hi Scott – thanks for the great feedback and I really appreciate you took the time to write a comment. Interesting point about the short position to hedge. I did take a small short position at a very strong resistance point. In other words I did not short at the same time as going long on stocks. I waited for a strong rally in stocks and then shorted at what I believed what an extended move. So if stocks do start going down I won’t take a lot of heat.
More on this later – I am glad you mentioned this as I want to do some hedging strategy classes in the new year. Cheers. Alessio